Visualization generates new data. The infographic itself becomes research material. One question answered reveals ten more worth asking.
Data arrives digital. The last mile should be physical. Weight, texture, smell. Hand-cut cardboard says something pixels can't.
SQL to spray paint. Blender to wood carving. AI generation to felt-tip pens. Use every tool available because the goal is actionable insight, not tool purity.
My parents gave me a mandolin when I was young. Non-players themselves, they signed me up for the mandatory courses and practices. I hated it.
Music didn't click until high school. Jimi Hendrix, Metallica, Slipknot. I'd jump around while studying with headphones on. Eventually I thought, why not pick up a guitar and learn these songs?
That started everything. I met musicians from all ages, joined bands, got kicked out of bands, played live gigs, made recordings. Guitar led to music theory, jazz standards, walking bass lines, drums, Ableton. It kept going.
Frequencies are everywhere. Light is a frequency. We're not just hearing sound but feeling it with all those vibrations. With spectrums and audio analyzers we can see harmonics and understand what changes create what effects. I play with notes and frequencies to express feelings and moods.
Sometimes a bird sound starts a new tune. Sometimes it's a drum lick I stumble on, or limiting myself to an unfamiliar scale to see what happens. There's no single method. That's self expression.
My sound has evolved from those Metallica days. More instrumental now, cleaner. Closer to Vulfpeck and The Doors.
No TV. No big couch. Our living room has instruments, books, wood craft, and laser engravers.
Current setup: Roland e-drums, Ableton Live, Casio e-piano, Kontakt MIDI keyboards, Gibson and Fender Strat, Cort bass, two acoustic guitars, recording gear.
I made a DecentSampler plugin called ERBVOK. Hand-coded for my needs, but useful for other musicians too.
You can open it without a DAW and play with regular keyboards, not just MIDI. It has built-in knobs assignable to any MIDI controller or mouse. Filter, chorus, reverb, loop length, fuzz.
I recorded my voice singing in low E and sampled it across all keys. Simple, but it works as bass, chords, high-end melodies.
Download ERBVOK for free Get the .zip file here
After founding Bitti Gitti, I made songs to showcase the Wooden Sound System's volume boosting. The Spotify page has that collection.
The Musical Wheel: A wooden disk with holes showing only diatonic notes in any selected key. Turn the wheel, see the perfect notes with their relative degrees. Still working, still available at Bitti Gitti.
Wooden Sound System (Recording Version): The original was for listening. Now I'm building one for recording. Place your smartphone in, record surrounding sounds, make synths or capture vocals and piano performances.
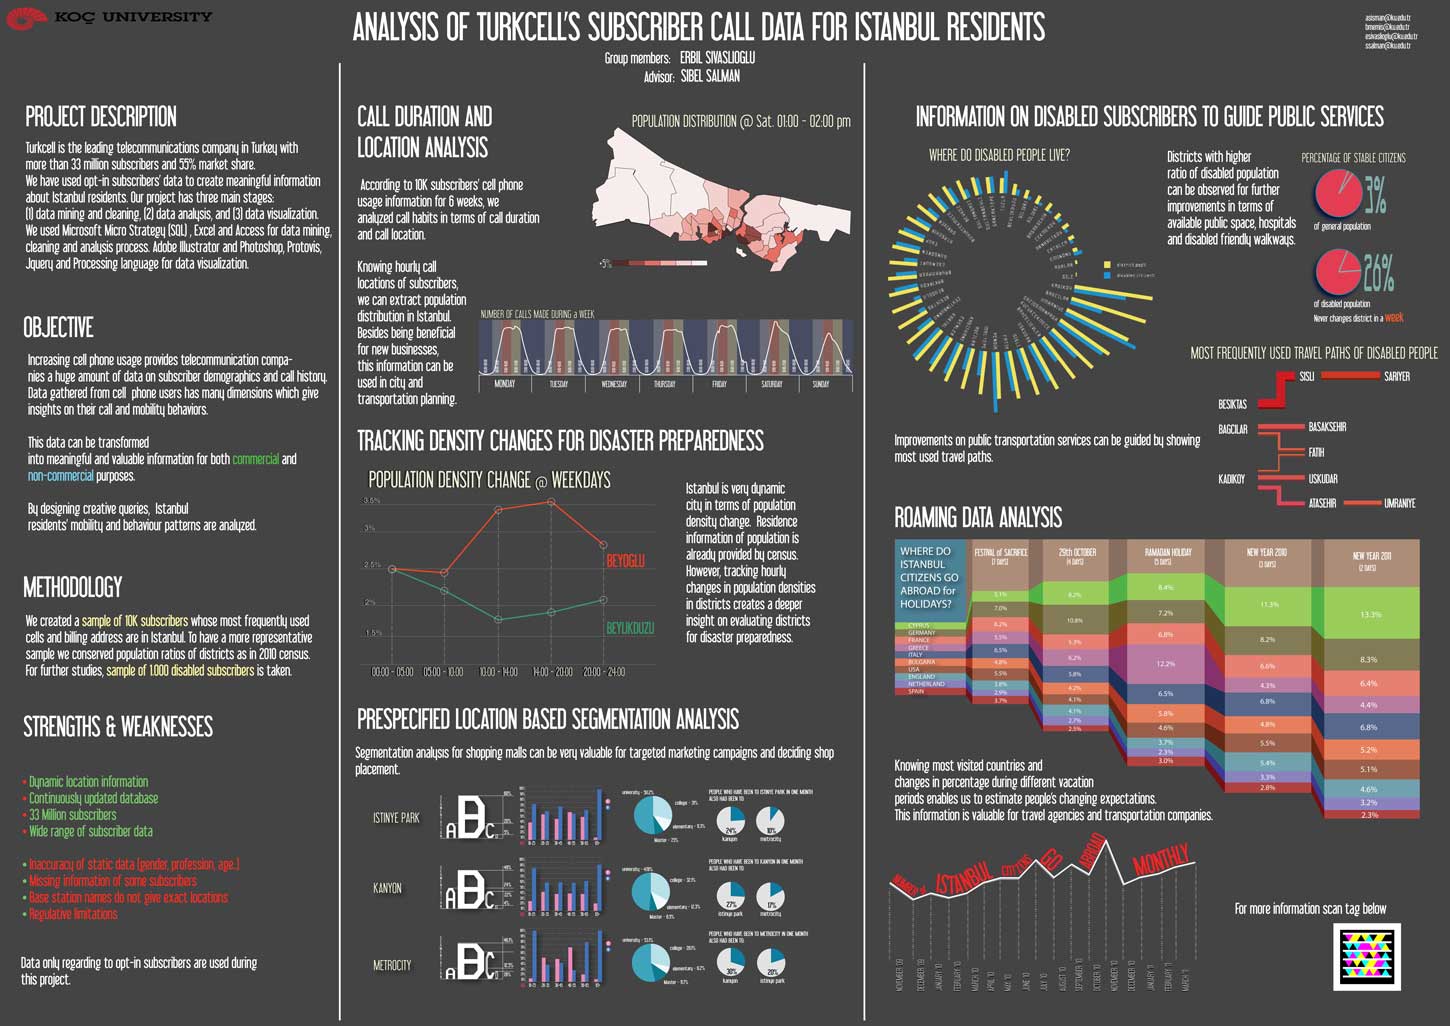
Sankey diagram showing Istanbul citizens' holiday travel patterns by destination and trip duration. One visualization answering: which holidays, which countries, what percentage, how long.
Built from GSM network data. Used by tourism planning authorities and transportation companies to predict seasonal demand.
A data curve shaped like a valley doesn't need to be abstract anymore.
Generate the hyper-realistic landscape. Then laser cut it.
Then hand it to your team to paint with felt-tip pens.
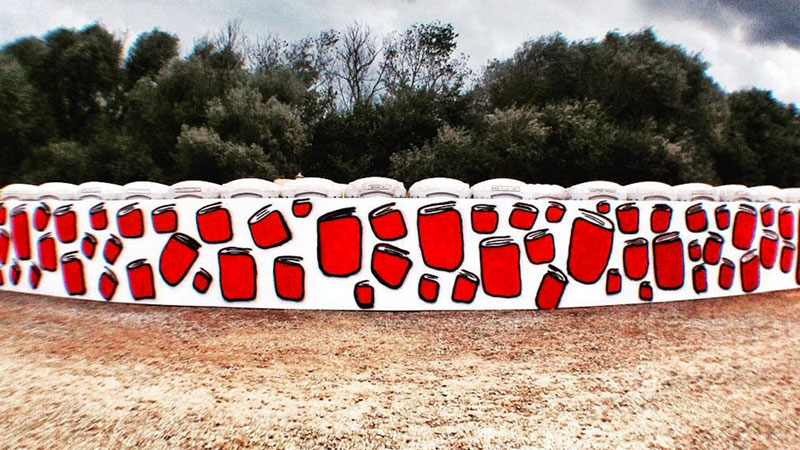
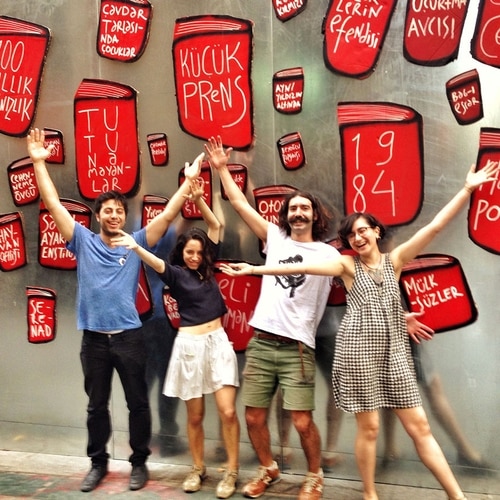
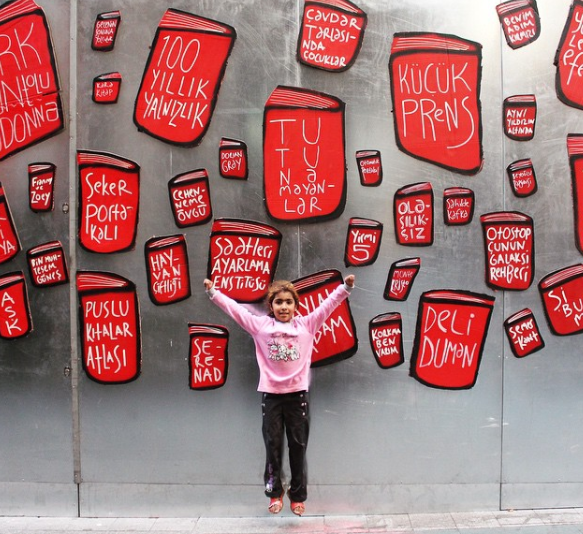
Asked communities at street events: "Your 3 most loved books?" Hand-cut cardboard books, painted red, labeled with Posca pen.
Then we left the wall on the street for 72 hours and tracked which titles people stole to hang in their rooms.
Two data layers: what people say they love vs. what they take home.
The visualization became the research instrument.
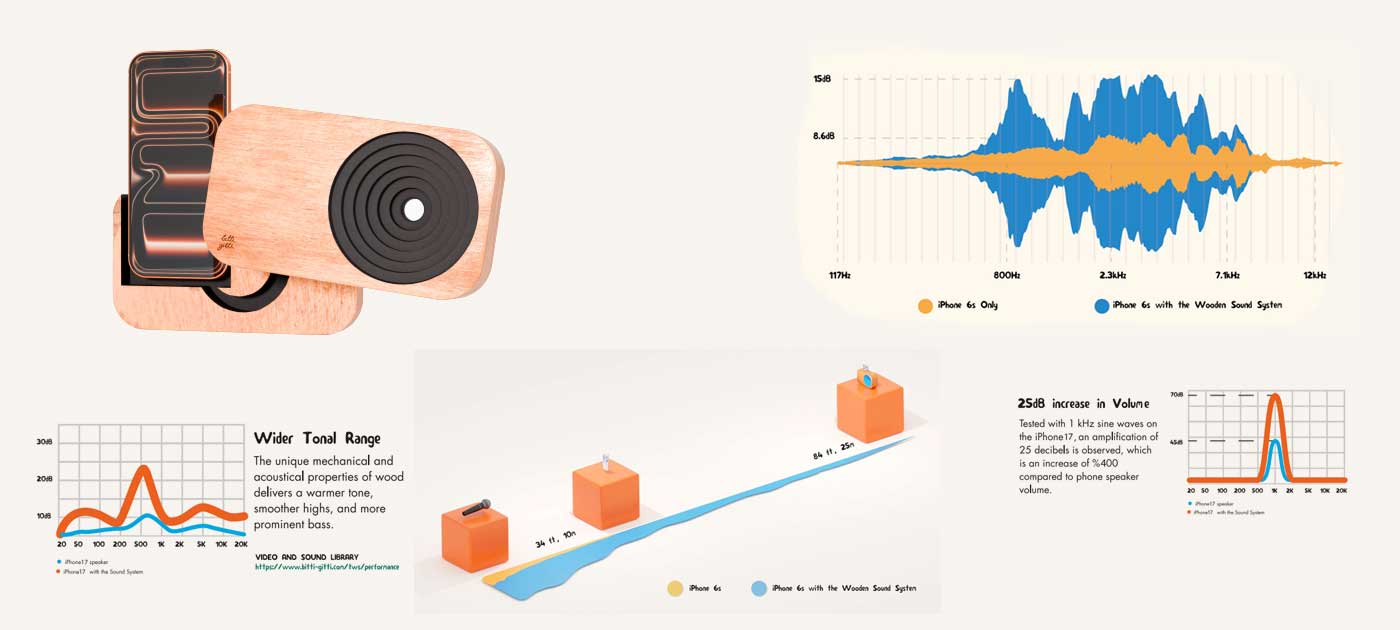
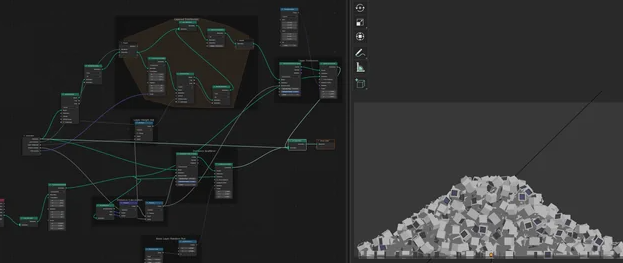
When it comes to visualizing sound, and changes in frequencies 3D visualizations help a lot. These renders are not just made for visual, but to deepen the understanding of the changes I'm making on the Wooden Sound System's passive amplification of sound.
A simple 1K Hz signal test, can help visualizing the peak increase but why stop there? Here are some of the experiments.
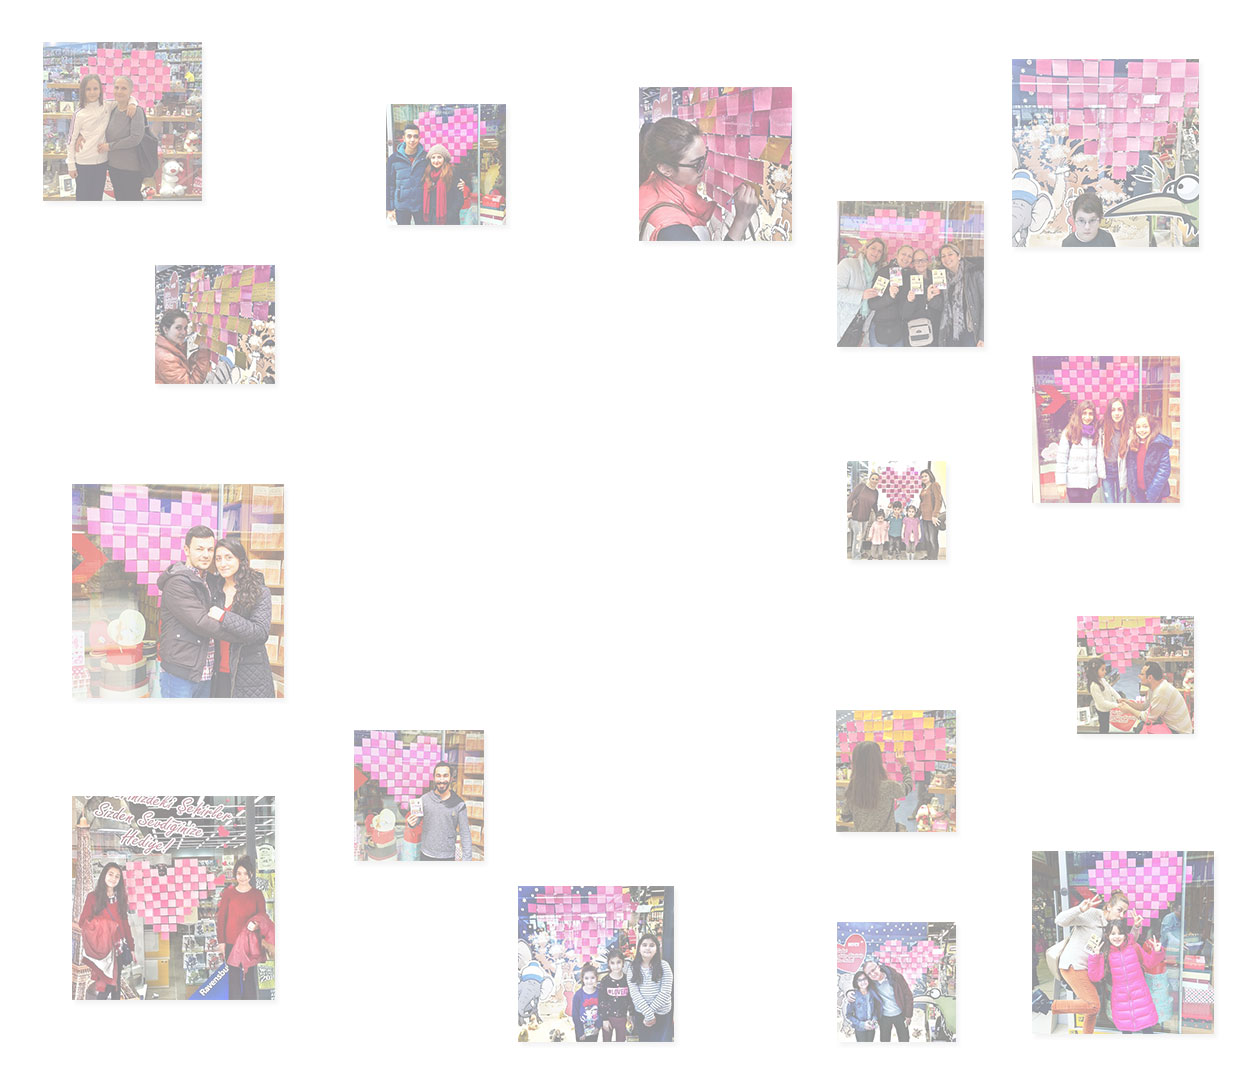

Valentine's Day installation for 3M. Pixelated hearts made from pink Post-its on bookstore windows across the city.
Each person removed one, wrote their message, put it back. The installation filled itself with user-generated content. Hundreds participated. Thousands posted photos.
Design becomes participation platform. Participation generates content. Content spreads organically.
SQL queries, algorithmic analysis, pattern recognition. Finding the signal in millions of data points through rigorous computational methods.
With tools like Processing, Blender, and 3D printing, we translate insights into forms that bridge the screen and the physical world.
From wood carving and spray painting to hand-cut cardboard and Posca pens, this is the final mile where data becomes something you can smell and feel.
Designing for emergence, creating conditions where communities generate data through natural interaction, playful theft, and contribution.
Started at a TOFAS production line during my first industrial engineering internship - rearranged modules to free up 30m² while maintaining ergonomics and timing constraints. Fell in love with production, machining, and optimization right there.
Graduated from Koç University Industrial Engineering with Best Final Project Award - mapped Istanbul's movement patterns through GSM data, work that influenced municipal infrastructure and emergency planning.
Moved deeper into data at Turkcell, managing mobile ad optimization systems with millions of data points.
Then London - Shillington College to learn design. Realized good ideas need good presentation. Design isn't just aesthetics, it's how things work. Started building apps and websites for my own projects. Freelancing evolved - custom sites for Google, startups across Europe.
Pattern emerged: companies have employees who need to learn, create, be engaged. Hand craft met corporate needs.
Founded BittiGitti - screen printing kits, cyanotype sets, notebook-making workshops. For homes and corporations. The same pitch energy from "I'll build your custom site" became "I'll design your memorable workshop."
Co-founded BookSerf - book-sharing platform where reading data became street murals that generated their own social research.
Built a Wooden Sound System that won the German Design Award 2018. Required acoustic frequency visualization to optimize.
The thread: optimization never stopped. Factory floors. Data systems. Websites. Workshops. Physical products. They're all the same practice - finding better arrangements, making patterns visible, turning constraints into opportunities.
Custom data visualization, illustration, and product design are where it all converges.
Clients: Turkcell, 3M, Google, Airbnb, Mercedes, and startups that needed something no agency could template.
Based in Istanbul. Working globally.